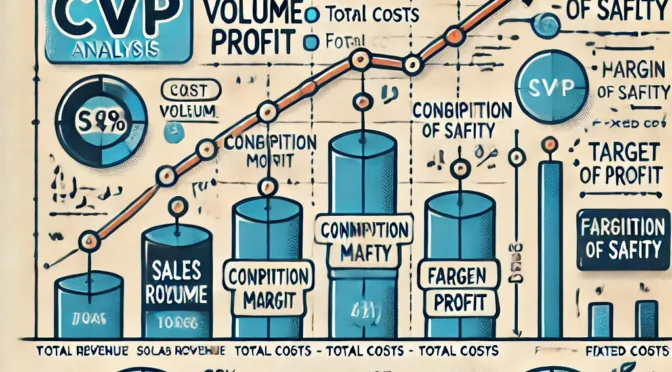
Chapter 6 of “Managerial Accounting: An Introduction to Concepts, Methods, and Uses” focuses on Cost-Volume-Profit (CVP) Analysis, a fundamental tool in managerial accounting that helps managers understand the relationship between costs, volume, and profit. This analysis is crucial for decision-making related to pricing, product mix, and the impact of cost changes on profitability.
Key Topics in Chapter 6
- Understanding Cost-Volume-Profit (CVP) Analysis:
- CVP analysis examines how changes in costs and volume affect a company’s operating income and net income. It helps managers make decisions about sales volumes, pricing strategies, and cost management.
- The analysis is based on several assumptions: costs can be classified as either fixed or variable, the selling price per unit remains constant, and all units produced are sold.
- Key Components of CVP Analysis:
- Contribution Margin (CM): The difference between sales revenue and variable costs. It represents the amount available to cover fixed costs and contribute to profit.
- Contribution Margin Ratio (CMR): The contribution margin expressed as a percentage of sales revenue.
- Break-Even Point (BEP): The sales volume at which total revenue equals total costs, resulting in zero profit. It is a critical figure that shows the minimum sales required to avoid a loss.
- Target Profit Analysis: Determines the sales volume required to achieve a specific level of profit.
- Break-Even Point Calculations:
- The break-even point can be calculated in units or sales dollars. It helps in understanding the level of sales needed to cover all costs.
- Margin of Safety:
- The margin of safety represents the amount by which actual or projected sales exceed the break-even sales. It provides a cushion against sales fluctuations.
- Operating Leverage:
- Operating leverage measures how sensitive net operating income is to a percentage change in sales. Companies with high fixed costs have high operating leverage, meaning their profits are more sensitive to changes in sales volume.
Math Problem and Solution from Chapter 6
To illustrate Cost-Volume-Profit Analysis, consider the following problem:
Problem:
A company, XYZ Corp., sells a product for $50 per unit. The variable cost per unit is $30, and the total fixed costs are $40,000 per month. Calculate the break-even point in units and in sales dollars, the number of units needed to achieve a target profit of $20,000, and the margin of safety if actual sales are $150,000.
Solution:
- Calculate the Contribution Margin per Unit: The contribution margin per unit is the difference between the selling price per unit and the variable cost per unit. $$
\text{Contribution Margin per Unit} = \text{Selling Price per Unit} – \text{Variable Cost per Unit}
$$ Substituting the values: $$
\text{Contribution Margin per Unit} = 50 – 30 = 20
$$ - Calculate the Break-Even Point in Units: The break-even point in units is the number of units that must be sold to cover all fixed and variable costs. $$
\text{Break-Even Point in Units} = \frac{\text{Total Fixed Costs}}{\text{Contribution Margin per Unit}}
$$ Substituting the values: $$
\text{Break-Even Point in Units} = \frac{40,000}{20} = 2,000 \, \text{units}
$$ - Calculate the Break-Even Point in Sales Dollars: The break-even point in sales dollars is the amount of sales revenue needed to cover all costs. $$
\text{Break-Even Point in Sales Dollars} = \text{Break-Even Point in Units} \times \text{Selling Price per Unit}
$$ Substituting the values: $$
\text{Break-Even Point in Sales Dollars} = 2,000 \times 50 = 100,000
$$ - Calculate the Units Needed to Achieve Target Profit: To calculate the number of units needed to achieve a target profit, add the target profit to the total fixed costs and divide by the contribution margin per unit. $$
\text{Units for Target Profit} = \frac{\text{Total Fixed Costs} + \text{Target Profit}}{\text{Contribution Margin per Unit}}
$$ Substituting the values: $$
\text{Units for Target Profit} = \frac{40,000 + 20,000}{20} = \frac{60,000}{20} = 3,000 \, \text{units}
$$ - Calculate the Margin of Safety: The margin of safety indicates how much sales can drop before the company reaches its break-even point. $$
\text{Margin of Safety in Dollars} = \text{Actual Sales} – \text{Break-Even Sales}
$$ Substituting the values: $$
\text{Margin of Safety in Dollars} = 150,000 – 100,000 = 50,000
$$ The margin of safety in percentage terms: $$
\text{Margin of Safety Percentage} = \frac{\text{Margin of Safety in Dollars}}{\text{Actual Sales}} \times 100
$$ $$
\text{Margin of Safety Percentage} = \frac{50,000}{150,000} \times 100 = 33.33\%
$$
Conclusion
Chapter 6 provides a thorough understanding of Cost-Volume-Profit Analysis, which is vital for making informed managerial decisions. By analyzing how changes in costs, volume, and prices affect profitability, managers can make strategic decisions to optimize operations, set prices, and plan for future growth. The chapter emphasizes the importance of knowing the break-even point, contribution margin, and margin of safety to maintain financial health and achieve business objectives.
